|
Some of my first scrawling as a child was a list of birds I’d seen at my bird feeder. When I was around 8 I went through my grandfather’s National Geographic field guide and checked off every bird that looked familiar, ostensibly calling it my life list. Appalled by my apparent stringing and the sloppy check marks in his field guide, my grandfather begrudgingly gave me his copy and went out and bought a new one for himself. He wasn’t a particularly avid birder, and neither was my father, but they dabbled and together they helped spark a lifelong love affair. When I was around 13 they took me to Belize birding. Terrified of spiders, my grandfather stayed inside the whole time, but I dutifully recorded my sightings in a notebook, even scribbling “Cornell Lab of Ornithology” in the margins (that’s where I found myself working 25 years later). This notebook was the genesis of my honest list keeping efforts, and I still have it today. While my skill at and commitment to birding pales in comparison to most of my colleagues, I’ve been fortunate enough to see somewhere around 3,500 species globally at this point, 3,315 of which have found their way into eBird. These days I’m 41, have two little kids, too little money, and a long list of hopes and dreams growing far faster than my life list. The list of places I want to see before I die or their biodiversity is lost forever is impossibly long–I ain’t gonna see it all. Which got me to thinking, how can I prioritize this ever-growing bucket list? Suppose I was flush with time and money–where should I go birding? I decided to approach this question quantitatively. Taking my eBird life list as a baseline, I identified optimal travel destinations based on how different the birds in a location are when compared to what I'd seen before. Importantly, I decided to quantify these differences as a function of evolutionary distance. In other words, I assumed that species that are not closely related to those I’ve seen before are precisely the species I want to travel and see. This is normally a pretty safe assumption–the ten most distantly related species as compared to what I’ve seen before are the two golf ball-eating seriema species, the three screamer species, the weird-as-hell Madagascar endemic Cuckoo-roller, the three mesite species, and Secretarybird (which really seems like it should have gone extinct from thirst by now). Dinosaurs, basically, and notably ones I have not seen before (unlike Hoatzin). Assumption validated. I extracted 74 million high-quality eBird checklists globally, binned them into hexagonal grid cells, and matched each of the unique 11,017 species contained within these checklists to a tip in a comprehensive global avian phylogeny in Clements 2023 taxonomy. Hold my beer. This gets complicated fast, so let’s start simple. I’ll begin with some plots that don’t have anything to do with my own observations. First up, how many unique species occur in a grid cell?  The first thing you’ll probably notice is that there are some gaps in global eBird data. Setting that aside, most of the obvious hotspots pop out here, as does the latitudinal diversity gradient, although you need to squint to see it for some of the data poor areas. The Andes and the western Amazon are chock full of species. So is eastern Africa, the Atlantic Forest, and the Himalayas. Something worth pointing out–for this and all the other maps I’ll be showing, I’ve binned values into quantiles to ensure a visually appealing spread of colors across the globe. If I didn’t do that, what you’d see is a mostly pale map with a few extremely dark hotspots–some of those grid cells in northern South America, which are a mere 1,770 km2, contain over 950 species! Next up, I’ll present the mean pairwise phylogenetic distance between all the species that occur in a grid cell. Put differently, this measures the average amount of evolutionary time that has elapsed since two species in a community shared a common ancestor. Reminder, we haven’t yet made the leap to my own bird observations. 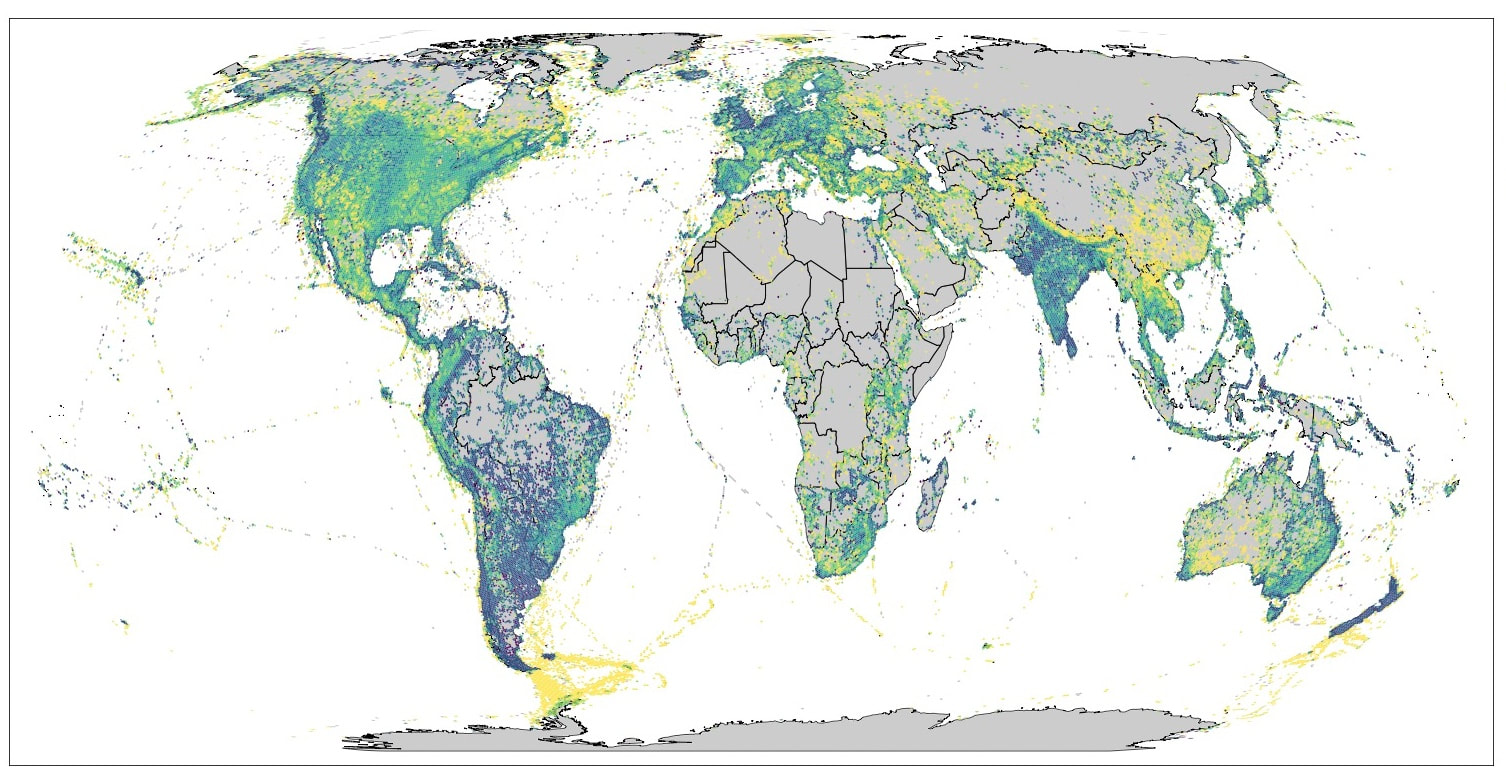 Here, some really interesting patterns pop out. The Amazon is characterized by species that are phylogenetically distant from one another, but as you climb the Andes, the species become increasingly closely related. The pattern is even starker in the Himalayas, where over a relatively short geographic distance it goes from distant relatives co-occurring with one another, to increasingly closely related species co-occurring at higher elevations and into the Tibetan rain shadow. The data is sparse, but the deep evolutionary divergences between species in Madagascar (remember, Cuckoo-roller and mesites), lower elevations in Papua New Guinea, Southern South American, and large parts of Southeast Asia also emerge here. These divergences contrast with the profound phylogenetic clustering of arid and high latitude communities in places such as western Australia, the Sahara, and the Southern Ocean. Now let’s dive into the main goal of this exercise. For this, I needed to adapt a few existing phylogenetic diversity metrics to specifically facilitate comparisons between my life list and a given “community” (the species in a grid cell). The first metric is the easiest of the three to understand. What I’ll be showing here is the total novel phylogenetic diversity I could potentially add by visiting a grid cell. To visualize what this means, consider an evolutionary tree representing all the species I have seen. This novel phylogenetic diversity metric calculates the total branch length that would be “grown” onto this tree if we plugged these new species into that original tree of all my sightings. Thus, this metric increases as a function both of total new species I could see, and their evolutionary uniqueness; more species equals more branches and unique species equals longer branches.  Clearly, I need to get to eastern Africa (Secretarybird!), the Himalayas and, if you squint, Madagascar! The same is true for large parts of Southeast Asia and Papua New Guinea. New Zealand pops here, but I have actually been there, it’s just that I lost my notebook and never entered the observations into eBird. Wouldn’t mind going back though. Only saw the North Island, and I need to see some Kiwis. Like I said, I have friends who are way more committed to birding than I am. I ran the same calculations for a friend who’s seen closer to 4,500 species, and this is his corresponding novel phylogenetic diversity map.  My friend clearly needs to get to the Amazon, the Himalayas and Western Ghats, and eastern Australia. I tried a few more metrics to see what would work best to identify important “must-bird” areas. One of these measured the average evolutionary distance between all members of a given grid cell and those on my life list.  This is a little tricky to interpret, because it’s an average across all the birds I’ve seen globally and those in a given site. The most obvious result here is that, on average, coastal/marine communities, particularly the Southern Ocean. contain a set of species that differs notably from the average bird on my life list. This isn’t particularly surprising. I get super seasick, stay the hell away from the ocean, and generally am a landlubber. I don’t love this metric, but it might be more useful if it was instead something like the distance between your average eBird list and a given community. On a local scale, for example, this would show where you could go to mix up your average birding adventure. The last metric is a measure of the average evolutionary uniqueness of all the species in a community as compared with my life list. This is similar to the novel phylogenetic diversity metric, but it's driven only by the average uniqueness of species within that grid cell. The number of species I stand to see by visiting a given grid cell doesn’t matter here. It’s simply a measure of how evolutionarily unique are the species in a site as compared with my life list.  Again, coastal and pelagic sites pop here, but Madagascar and the South Pacific really stand out as well. The contrast between this and the novel phylogenetic diversity map is important. If I can score me a safari in Kenya or Tanzania, I could tick hundreds of new species, many of them fairly distantly related to what I’ve seen before; if I get to Madagascar or the South Pacific, I’m going to be reveling in slightly less species-rich communities, but the new species I see will be super weird and unrelated to the birds I’m used to. For example, of the 45 bird families I am yet to see in the world (there are 251 bird families globally), five are found only in Madagascar: Mesitornithidae, Brachypteraciidae, Philepittidae, Leptosomidae, and Bernieridae.
Time to get rich and famous I guess. It seems like I need to get to Madagascar, eastern Africa, the Southern Ocean, the Himalayas, and Papua New Guinea soon, among other places. What do you think of this exercise? Did I calculate the right metrics? Are there other things you find yourself wanting to know? Where would your priority travel areas be?
0 Comments
 Our article on drivers of plumage evolution in woodpeckers came out on Monday. In it, we discuss habitat, climate, and social drivers of plumage coloration and patterning in woodpeckers. This article was intended to be one of the first empirical tests that interspecific plumage mimicry truly does happen in birds (see my previous post on the subject). We found strong support that it does. Of course, we weren't able to squeeze all the fun figures, results, and discussion into the paper that we wanted to. I'll be slowly releasing some of that here in the coming days. Here's a fun NMDS plot Rusty Ligon just made. It does a great job of graphically presenting the global diversity of woodpecker colors and patterns in an intuitive manner.
Birds, with a few whacky exceptions (Dumbacher et al. 2008), are not poisonous to eat. I feel like I should cite this paper (Cott & Benson 1969) now too, because I'll probably never get another chance. And, aside from another weird exception (Londoño et al. 2015), birds don't usually look much like anything poisonous. It makes sense then that, unlike butterflies, there's very little Batesian or Müllerian mimicry driving the way birds are colored and patterned. Yet, there are some pretty remarkable instances of what seem to be plumage mimicry in birds. People have talked about these patterns for over 150 years (Wallace 1863), but whether or not these patterns represent socially-mediated convergence, convergent responses to similar environmental pressures, or simply shared evolutionary history has never adequately been resolved (Stresemann 1914, Murray 1976), although recent work has strongly supported the existence of the pattern (Jønsson et al. 2016). Moreover, what the selective pressures might be that would drive such remarkable convergence has been debated (Moynihan 1968, Cody 1969, Barnard 1979, Diamond 1982, Prum 2014). The result has been shockingly little discussion in the literature about what is, if fully corroborated, one of the coolest patterns in birds (me).
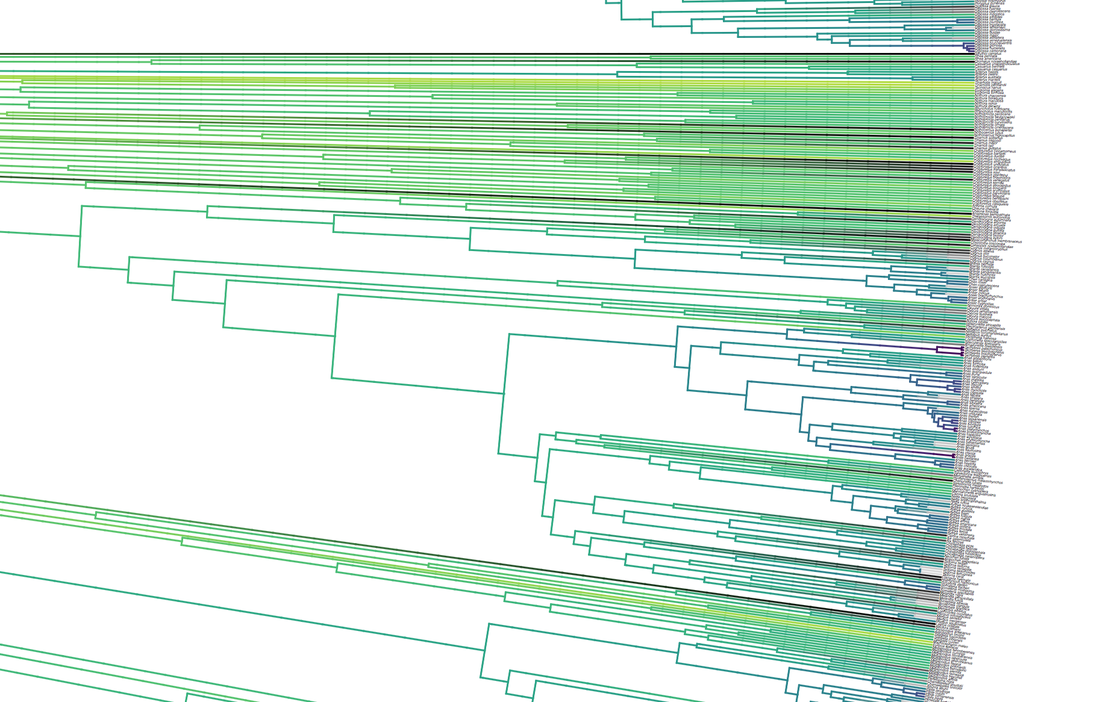
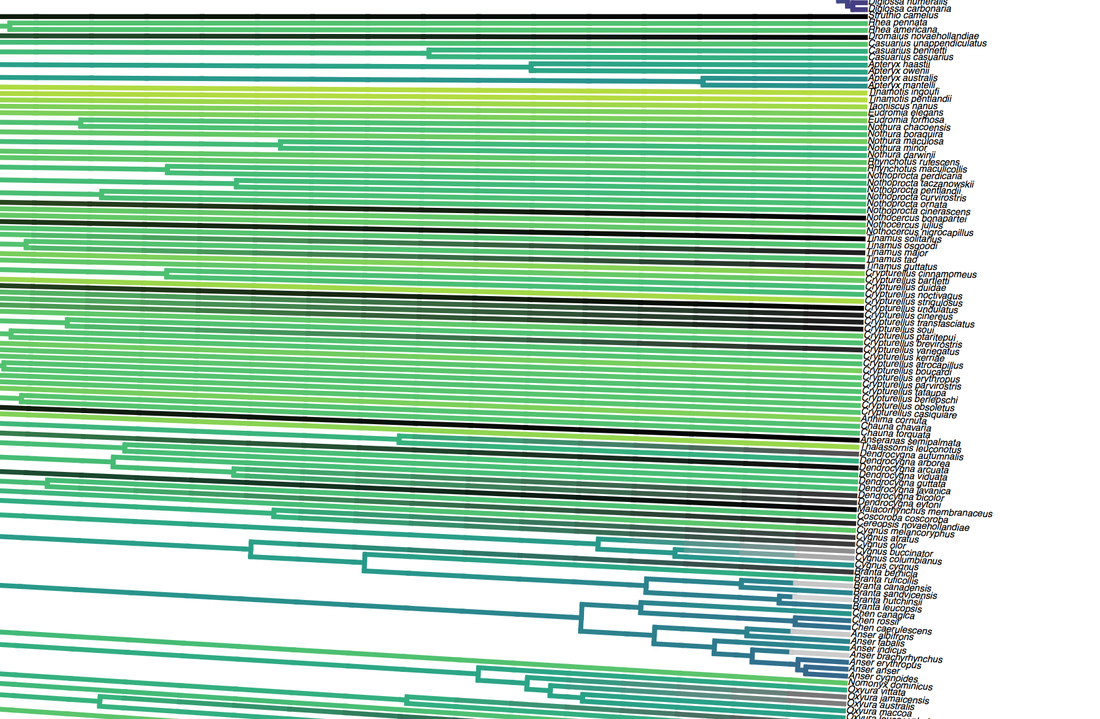
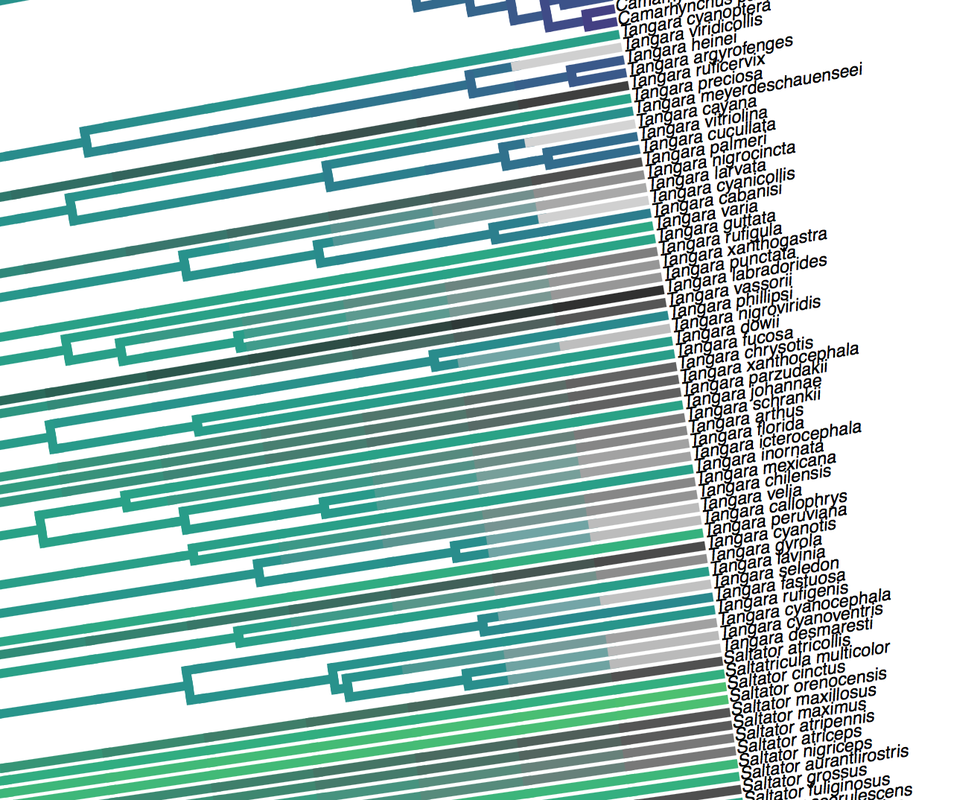
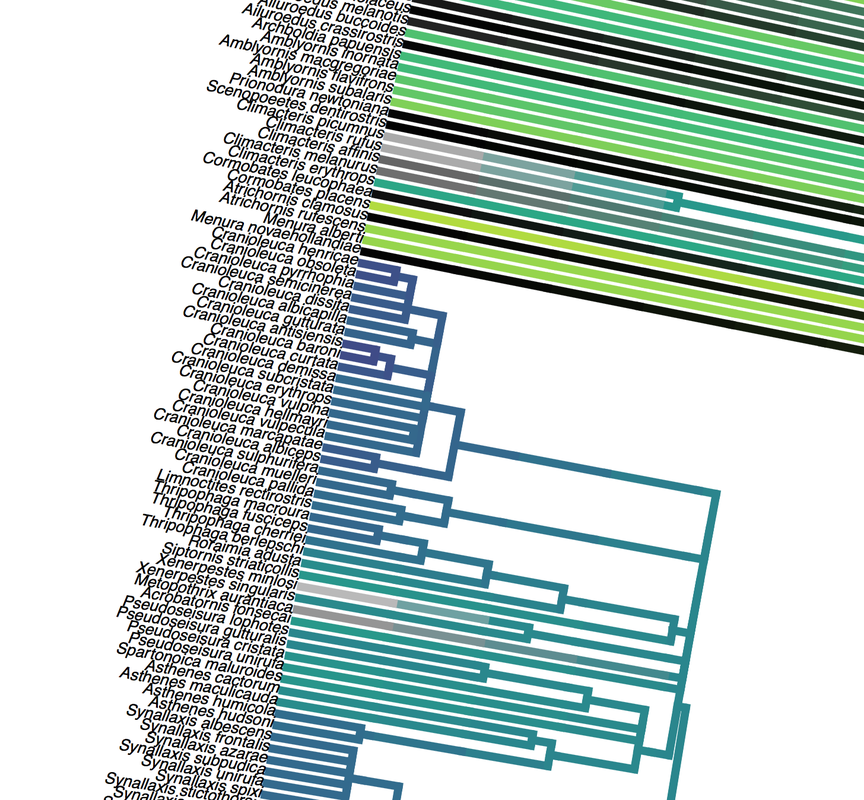
[Full disclosure: I proposed doing my dissertation on this subject, but since I didn't have any good related research ideas at the time, that didn't happen]. I'll give you three quick examples. Downy and Hairy Woodpeckers, common backyard denizens and frequent feeder visitors across North America, are not particularly closely related--they are each more closely related to dissimilar looking species--yet they somehow have evolved to look nearly identical to one another in plumage (Weibel & Moore 2005). Ramphastos toucans can be split into two major clades: croakers and yelpers. Across the Americas one can frequently find two sympatric species, one from each clade. And, in approximate parallel across the Americas, they track one another in plumage. White-throated and Channel-billed Toucan in the Amazon, Chestnut-mandibled and Keel-billed in Central America, etc (Weckstein 2005). Then, on either side of the Andes, you have three suboscine genera--Lipaugus, Rhytipterna, and Laniocera--each with a "single" (it's not quite that simple) species on either side. West of the Andes, up into Central America, these are all rufous colored; East of the Andes, these are all gray. Ridgely and Tudor talked about this somewhere in Birds of South America (1994), which was my first exposure to the idea, and Diamond (1982) and Prum (2014) have also talked about it. Anyhow--what? What could possibly be the selective pressures that would drive that? Why would three similar-shaped, somewhat ecologically similar species all "decide" to turn gray in sympatry in the Amazon, and rufous in sympatry in Central America? It certainly doesn't seem like substrate matching. Well, as it turns out, there are at least 7 proposed hypotheses for why this could happen: 1) The larger species would suck to try and kill and eat, and the smaller species mimicked the model to make predators think twice before giving it a go (Wallace 1863). I'm going to add some slight details to this idea, since a paper we're working on now will be able to shed some light on it: the larger (model) species is outside the preferred prey size range of smaller sympatric raptors, and the mimic enjoys reduced predation pressure by looking like the model. 2) All species involved converged on the phenotype to facilitate flocking behavior and thereby reduce predation pressure (Barnard 1979). 3) All species involved converged on the phenotype to facilitate flocking and encourage stereotyped behavioral interactions between flock members (Moynihan 1968). 4) All species involved converged on the phenotype to facilitate interspecific territorial interactions (Cody 1969). 5) The larger species converged on the model (the smaller species) so as to fool predators into believing it to not be a worthwhile target (the skin and bones hypothesis). I don't know a citation for this idea, but it's out there. 6) The smaller species converged on the model so as to confuse the model and experience reduced aggression from the model (Diamond 1982, Prum & Samuelson 2012). 7) The smaller species converged on the model so as to confuse third parties and hold a more dominant position around contested resources than it otherwise would (Wallace 1863, Diamond 1982). NB: in our recent paper (below), we attributed this last idea solely to Wallace, a view likewise stated by Prum and Samuelson (2012) and Prum (2014). However, I have recently more carefully read those original Wallace papers, and Jønsson et al. (2016) and Diamond (1982) are more accurate in stating Wallace's idea had to do with hypothesis 1, above. To be fair, Wallace was sort of agnostic about the precise driver, and his brief passages could be interpreted as giving rise to hypothesis 7, but I now think hypothesis 7 is best attributed to Diamond (1982). I guess the moral of the story is that arguing 155 years later over which evolutionary driver Wallace was invoking four years after the publication of the Origin of the Species is a fool's errand. Wallace seems like a fine choice. So what is the evidence for and against each of these hypotheses? 1) Sorry, but you'll have to keep your eyes out for our third installment from Project FeederWatch, which looks at the predation data that participants have submitted. Otherwise, no experimental evidence in birds that I know of. Hypothesis 1 remains standing. 2) Seems unlikely to me that species would converge on visually obvious phenotypes when they could just as well blend into the background, but I guess that doesn't kill this hypothesis entirely. To invoke sexual selection as as a driver of bold plumages, and then suggest this group-level selection somehow drives near perfect plumage convergence seems fraught, but we'll leave it as a hypothesis someone with a lot of time on their hands might want to look into. 3) Community selection? Not a lot of support for that. Here are Moynihan's 5 predictions from his paper. A) Related species which are sympatric will usually be more similar in overall appearance, on the average, than equally closely related species of similar habits which are allopatric. B) The closer and more frequent are the contacts between individuals of sym- patric species, the closer will be the resem- blances between them. C) Resemblances among sympatric spe- cies should be positively correlated with age of sympatry. Species which have been sympatric for a long time (without diverg- ing ecologically to such an extent as to prevent contacts between individuals of the different species) will be more similar in overall appearance, on the average, than comparable species which have been sym- patric for a short time. D) "Old" faunas (which have evolved for some appreciable length of time with- out being invaded by species from other areas) should include larger numbers of similar-appearing species than otherwise comparable "young" faunas. E) The strength and extent of resem- blances among sympatric species should be positively correlated with the number of species involved. The more species overlap and come into contact with one another frequently, the more likely it is that they will evolve convergent resem- blances for social mimicry. (This, of course, is one of the reasons why social mimicry is more conspicuous, and pre- sumably more common, in tropical conti- nental areas than in other regions.) There is strong evidence against most of these ideas, e.g. (Martin et al. 2015, Pigot & Tobias 2013). So, I'd say we can scratch hypothesis 3 off the list. 4) Again, there is not much empirical evidence out there showing that natural selection operates at these sorts of community levels. Species that hold mutually interspecific territories appear fully capable of distinguishing one another based on numerous characteristics such as vocalizations--they don't need to look like one another to make those distinctions. The idea here is that looking similar means that interactions between individuals are "definite". We look like each other so we know we're fighting here, no beating around the trunk trying to figure out if we want to fight at all. Many species that are agonistic towards one another over large portions of their range look nothing alike, and many species that look alike do not seem to hold interspecific territories. Given that, plus all the other selective pressures on plumages, I find this hypothesis really unlikely. Let's scratch it off the list. 5) Maybe, but unlikely in my opinion. We should hopefully be able to indirectly address it in our forthcoming FeederWatch predation paper. A prediction would be that both species would suffer low predation risk. I'm not saying it's impossible, but it would be much like a monarch mimicking a tasty skipper butterfly. 6) I see Hairy Woodpeckers occasionally displace Downy Woodpeckers in the forest in natural settings. Kilham (1972) saw a Campephilus woodpecker displace its mimic Dryocopus in Panama. Most birds seem able to recognize specific individuals of their own species. I have always found the idea that the purported model species somehow chooses not to attack the smaller mimic, when it would likely attack an unknown individual of its own species, difficult to believe. Fortunately, we don't have to rely on my feelings for whether to strike this hypothesis from the list. In a recent paper (Leigton et al. 2018) we tested the idea, and found strong evidence against it. Instead of experiencing reduced aggression, Downy Woodpeckers (the purported mimics) receive ample aggression from Hairy Woodpeckers--much more than would be expected based on the species' relative abundances. There is a slight caveat here: our study took place around feeders, which could be argued are artificial boxing rings. Yet, the evidence came down so hard against this idea, I'm striking it from my own list of reasonable hypotheses. Show me some experimental evidence and I'll change my tune. Instead of supporting this hypothesis, we found some support for the fact that... 7) It seems that Downy Woodpeckers hold slightly higher positions in the dominance hierarchy than would be expected based on their body mass and phylogenetic position. What do I mean by that? Well, we recently showed that woodpeckers tend to be dominant in general, and that body mass does a good job of predicting species' dominance ranks (Miller et al. 2016). So, even after accounting for that boost in dominance, Downy Woodpeckers are more dominant than expected based on their body mass. Indeed, they are predicted to be less dominant than House Sparrows, Song Sparrows, White-throated Sparrows, Yellow-rumped Warblers, and maybe even White-breasted Nuthatches (Leighton et al. 2018). So, is the fact that they look like Hairy Woodpeckers the thing that gives Downy the boost in the fight club rankings? We think it's likely, but the jury's still out. Literature cited: Barnard, C. J. (1979). Predation and the evolution of social mimicry in birds. The American Naturalist, 113(4), 613-618. Cody, M. L. (1969). Convergent characteristics in sympatric species: a possible relation to interspecific competition and aggression. Condor, 71(3), 223-239. Cott, H. B., & Benson, C. W. (1969). The palatability of birds, mainly based upon observations of a tasting panel in Zambia. Ostrich, 40(S1), 357-384. Diamond, J. M. (1982). Mimicry of friarbirds by orioles. The Auk, 99, 187-196. Dumbacher, J. P., Deiner, K., Thompson, L., & Fleischer, R. C. (2008). Phylogeny of the avian genus Pitohui and the evolution of toxicity in birds. Molecular Phylogenetics and Evolution, 49(3), 774-781. Jønsson, K. A., Delhey, K., Sangster, G., Ericson, P. G., & Irestedt, M. (2016). The evolution of mimicry of friarbirds by orioles (Aves: Passeriformes) in Australo-Pacific archipelagos. Proceedings of the Royal Society B: Biological Sciences, 283, 20160409. http://dx.doi.org/10.1098/rspb.2016.0409 Kilham, L. (1972). Habits of the Crimson-crested Woodpecker in Panama. The Wilson Bulletin, 84(1), 28-47. Leighton, G. M., Lees, A. C., & Miller, E. T. (2018). The Hairy-Downy game revisited: an empirical test of the Interspecific Social Dominance Mimicry Hypothesis. Animal Behaviour, 137, 141-148. https://doi.org/10.1016/j.anbehav.2018.01.012 Londoño, G. A., García, D. A., & Martínez, M. A. S. (2015). Morphological and behavioral evidence of Batesian mimicry in nestlings of a lowland Amazonian bird. The American Naturalist, 185(1), 135-141. Martin, P. R., Montgomerie, R., & Lougheed, S. C. (2015). Color patterns of closely related bird species are more divergent at intermediate levels of breeding-range sympatry. The American Naturalist, 185(4), 443-451. https://doi.org/10.1086/680206 Miller, E. T., Bonter, D. N., Eldermire, C., Freeman, B. G., Greig, E. I., Harmon, L. J., … Hochachka, W. M. (2017). Fighting over food unites the birds of North America in a continental dominance hierarchy. Behavioral Ecology, Online Early. https://doi.org/10.1093/beheco/arx108 Moynihan, M. (1968). Social mimicry; character convergence versus character displacement. Evolution, 22(2), 315-331. Murray, B. G. (1976). A critique of interspecific territoriality and character convergence. The Condor, 78(4), 518-525. Pigot, A. L., & Tobias, J. A. (2013). Species interactions constrain geographic range expansion over evolutionary time. Ecology Letters, 16(3), 330-338. https://doi.org/10.1111/ele.12043 Prum, R. O. (2014). Interspecific social dominance mimicry in birds. Zoological Journal of the Linnean Society, 172(4), 910-941. Prum, R. O., & Samuelson, L. (2012). The Hairy-Downy Game: A model of interspecific social dominance mimicry. Journal of Theoretical Biology, 313, 42-60. Prum, R. O., & Samuelson, L. (2016). Mimicry cycles, traps, and chains: the coevolution of toucan and kiskadee mimicry. The American Naturalist, 187(6), 753-764. Ridgely, R. S., & Tudor, G. (1994). Birds of South America Volume II, The Suboscine Passerines: Ovenbirds and Woodcreepers, Antbirds, Gnateaters, and Tapaculos, Tyrant Flycatchers, Manakins and Cotingas. Austin: The University of Texas. Wallace, A. R. (1863). List of birds collected in the island of Bouru (one of the Moluccas), with descriptions of new species. Proceedings of the Zoological Society of London, 1863, 18-28. Weckstein, J. D. (2005). Molecular phylogenetics of the Ramphastos toucans: implications for the evolution of morphology, vocalizations, and coloration. The Auk, 122(4), 1191-1209. Weibel, A. C., & Moore, W. S. (2005). Plumage convergence in Picoides woodpeckers based on a molecular phylogeny, with emphasis on convergence in downy and hairy woodpeckers. The Condor, 107(4), 797-809. Birders are a curious bunch. There are many millions of them in the world, and they range from mildly to severely obsessed with all things birds. Few things inspire such fevered participation by the fervent, and such bemused wondering by the uninitiated. Who else gets up on purpose at 4 AM on a non-workday? Birding can be a pretty minimalist hobby--you don't need much to watch birds, though a pair of binoculars is nice. Indeed, you don’t even need to see to be a good birder. [Birdwatching does have an unfortunate diversity skew--here's a funny post on that]. Despite that, there is no shortage of ways birders can spend their money. And spend it they do--a 2013 US Fish & Wildlife study estimated birders spend $107 billion/year on their pursuit of our planet's feathered denizens. Pretty cool if you ask me. Like I said, birders vary in the severity of their avian afflictions. There is a subset, not insignificant in absolute numbers, of people who know which birds they've seen, which birds they haven't seen, where those birds live, when to find them, and how to find them...in short, there are at least a couple hundred thousand people in the US who when I say, "there's a Rustic Bunting four hours away", respond, "get in the car." Given that mass of educated, passionate, motivated birders, one might think that there are no new ways to consider which birds one has or has not seen. But, after some discussion with various folks recently who have also had these ideas, it occurred to me that one aspect of birding has not been well explored outside of a few science nerd types. What I'm proposing here is a phylogenetic life list. In this context, evolutionarily unique species are "worth more". You might have been excited this spring when you ticked your first Golden-winged Warbler, but let me temper that enthusiasm for you. What you saw was, in an evolutionary sense, barely distinguishable from a Blue-winged Warbler (Toews et al. 2016). Come talk to me when you've seen a Kagu in the mountains of New Caledonia. Playing this sort of listing game, all new species (branches on the evolutionary tree) count towards your phylogenetic life list, but evolutionarily unique species count more. Put differently, seeing a Golden-winged Warbler (or a Kagu) ticks off one of the ~10,000 bird species to see globally under a traditional counting strategy (0.01% of all species to see in the world). But, under a phylogenetic life list strategy, seeing a Golden-winged Warbler ticks off just 0.003% of global unique evolutionary diversity, while seeing a Kagu adds 0.13%! I should digress and say taxonomy is hard. Converting the taxonomic concepts in my eBird life list to the taxonomy used by the Jetz et al. (2012) world bird tree took me a week's work. After that though, the rest was pretty easy. For the purposes of this post, there are two ways to consider evolutionary uniqueness. The length of the pendant edge of the species in question, and the mean relatedness of that species to all others. The pendant edge describes the amount of time that branch of the tree of life has been evolving on its own path (all caveats about extinction aside). Take the Kagu. It's evolutionarily unique according to this measure because its closest extant relative is the Sunbittern. They last shared a common ancestor 63 million years ago. Seeing a Kagu is kind of like seeing a velociraptor. In contrast, the mean relatedness describes the average evolutionary distance of a species to all others. In this context, species like tinamous and ostriches are even more evolutionarily unique than the Kagu, because tinamous and such are distantly related to the vast majority of other birds. I've made some visualizations to go along with this idea. This first one shows the world bird tree, pruned to the bird species that I've seen (according to eBird and as converted to world bird tree taxonomy). The evolutionary uniqueness of these species, according to the pendant edge method, is color-coded on there. I've also stretched branches out as a function of the pendant edge, so that evolutionarily unique species are colored in yellow, and are situated on long spines out from the tree. A friend affectionately called this an urchin plot. The plot is too low-resolution to zoom in, so I'll narrate it for you. At 3 o'clock are the Ostrich and Emu, and at 4 o'clock are the Sunbittern and Oilbird. Over at 8 o'clock is the Sapayoa. [I'm 100% convinced that there is a tight correlation between one-word bird names and evolutionary uniqueness, much like the tight correlation between one-word soccer player names and soccer skill]. 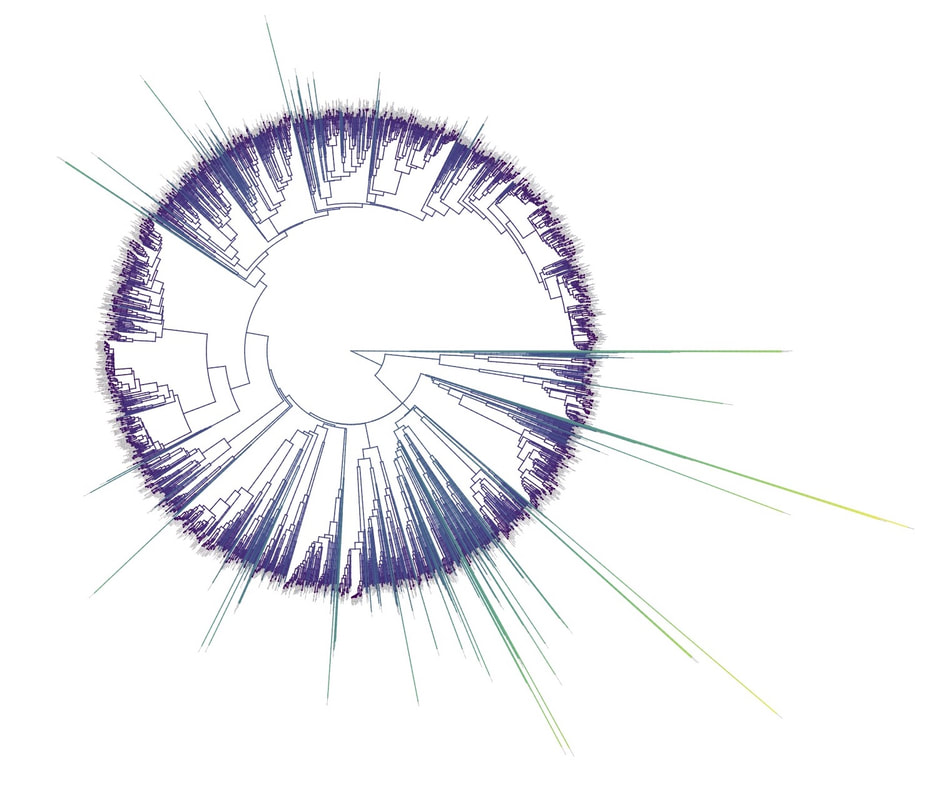 This second one shows the evolutionary uniqueness of all the species I've seen according to the mean distance measure. Here, tinamous and the like are really unique, whereas passerines, which comprise the bulk of avian diversity are not. 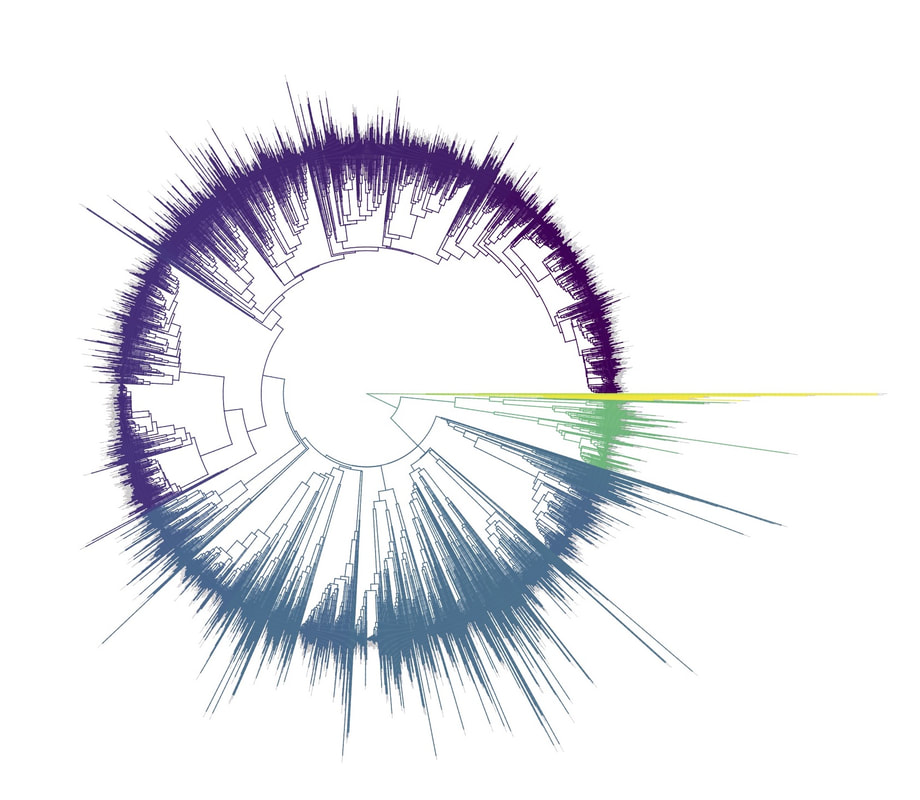 Last up is the entire world bird tree, with species I have and have not seen color-coded according to their (pendant edge) evolutionary uniqueness. Gray = not unique, I have seen it. Black = unique, I have seen it. Blue = not unique, I have not seen it. Yellow = unique, I have not seen it. Because it's such a large file, and I'm just adding a jpg of the zoomable pdf, I've added a few screenshots here to get a better sense of what's going on. 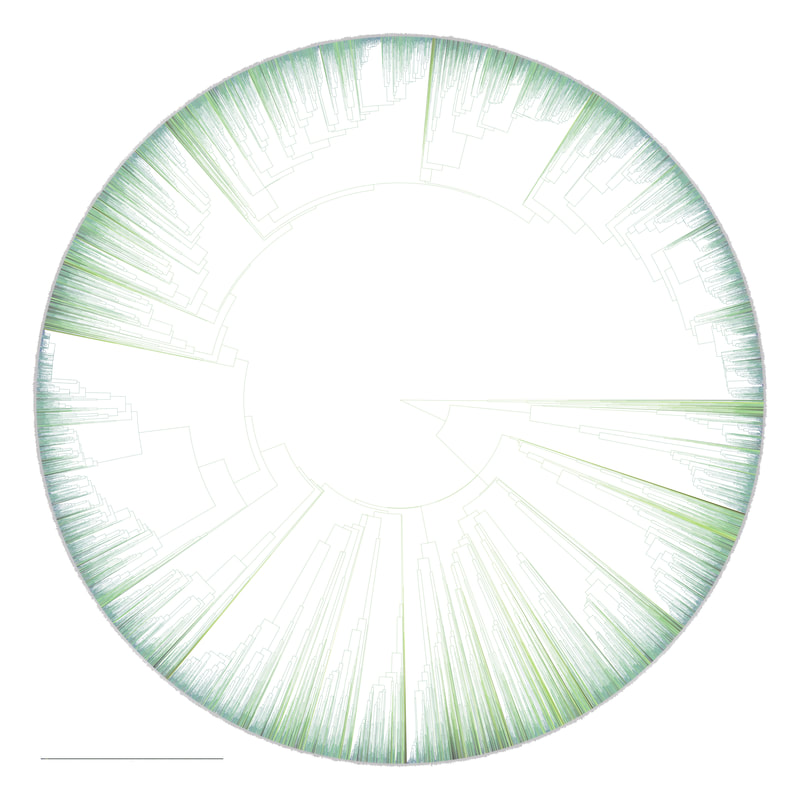 I see some obvious extensions of this. First, to return the hordes of interested birders, it would be pretty amazing to be able to generate these sorts of plots for any user of eBird, and serve these up in a more interactive setting. I think it presents some great opportunities for helping people to think about evolution and practice tree-reading skills. I'm thinking OneZoom-ish. Second, it would be really interesting to be able to put the phylogenetic life list in a geographic context. For instance, where on Earth should I go to see the most novel phylogenetic diversity in the most geographically constrained area? Or, if I visit my aunt in southern California, what would be the most evolutionarily unique species I might see?
Literature cited: David P.L. Toews, Scott A. Taylor, Rachel Vallender, Alan Brelsford, Bronwyn G. Butcher, Philipp W. Messer, Irby J. Lovette. 2016. Plumage Genes and Little Else Distinguish the Genomes of Hybridizing Warblers. Current Biology 26:2313-2318. DOI: http://dx.doi.org/10.1016/j.cub.2016.06.034 W. Jetz, G. H. Thomas, J. B. Joy, K. Hartmann, A. O. Mooers. 2012. The global diversity of birds in space and time. Nature 491: 444-448. doi:10.1038/nature11631 I'm excited to report that our first paper using citizen scientist-collected behavioral observations has been published in Behavioral Ecology (Miller et al. 2017). Well over a thousand FeederWatchers participated in the project, collecting data on aggressive interactions at feeders around North America. We assembled these interactions into a large directed network, and calculated some metrics of dominance. Ultimately, we settled on a modified version of the Bradley-Terry model (Bradley and Terry 1952) to calculate a species' dominance--other approaches yielded results that didn't make any biological sense.
In and of itself, this was a neat product--a continental dominance hierarchy of feeder birds! But what determined species' positions in the hierarchy? We found that, unsurprisingly, body mass explained a lot of the variance in species' positions. However, certain lineages (e.g., families) of birds tended to be more or less dominant than expected based on their body mass. Presumably, the members of these lineages share certain traits that make them more or less aggressive. Take woodpeckers for instance: long, heavy bills they wield against unwielding substrates every day. Or warblers: little, feather-clad bundles of anger. Ok, maybe that's not really a trait, but you get the point. We also looked for the existence of rock-paper-scissors relationships in the data. These sorts of relationships are interesting, as they are thought to promote local species coexistence (Levine et al. 2017); no species is able to gain a competitive advantage over all others. We found few such instances of these relationships, but those that we did find tended to involve invasive species. This seems like something worth following up in the future! Stay tuned for an upcoming blog about the paper on the FeederWatch page. Soon thereafter, keep your eyes peeled for a glossy article in the Living Bird, complete with original illustrations by Jillian Ditner! (http://jillianditnerstudios.com/). Literature cited: Bradley, R.A & M.E. Terry. 1952. Rank analysis of incomplete block designs: I. The method of paired comparisons. Biometrika. 39:324–345. Levine, J.M., J. Bascompte, P.B. Adler & S. Allesina. 2017. Beyond pairwise mechanisms of species coexistence in complex communities. Nature. 546:56-64. doi:10.1038/nature22898 Miller, E.T., D.N. Bonter, C. Eldermire, B.G. Freeman, E.I. Greig, L.J. Harmon, C. Lisle & W.M. Hochachka. 2017. Fighting over food unites the birds of North America in a continental dominance hierarchy. Behavioral Ecology. Online Early. doi:10.1093/beheco/arx108 Sarah Wagner and I spent many months between 2009 and 2012 in Australia chasing honeyeaters around. We visited some mind-bendingly cool places during that time, but it wasn't just for fun. We were chasing and watching honeyeaters, recording what they were eating and how they were getting it. We eventually were able to do this for almost all of the species (we never were able to find sufficient individuals of the tricky Gray Honeyeater), and that dataset is now available here. We complemented the foraging dataset with a museum-based morphometric dataset, also freely available here. It took a few years, but we've finally managed to synthesize those datasets into a paper on the honeyeater ecomorphology, recently published at The American Naturalist. You can find a nice press release for the paper here. Put briefly, we found that morphology largely predicts ecology, but that arid-adapted honeyeaters, which come from a restricted subset of lineages, use their phylogenetically conserved morphology in novel ways. We suggest that certain lineages have managed to invade the recently (15 million years ago recent) created deserts, and that the species from these lineages are exploiting the ecological opportunity afforded by these new habitats by shaking what their mama gave them, even if it's not quite suited to the task--desert honeyeaters do more with less. You can see some clips I shot of honeyeater foraging on YouTube (embedded below), including some short clips of the notably arid-adapted Gibberbird and Orange Chat...although the shot of the Gibberbird doesn't show it doing much at all, much less "doing more with less". Check out that Orange Chat though! Looks more like an Orange Sandpiper-Honeyeater to me. A few months ago, walking in the woods near our house, I came up with what I thought would be the phylogenetic equivalent of the trait-based metric functional dispersion (FDis, Laliberte & Legendre 2010). The metric would be the mean distance of a sample of taxa to their most recent common ancestor (MRCA). Almost as soon as the idea crossed my mind, I realized this new measure, let's call it distMRCA, was not exactly analogous to FDis. Given that in an ultrametric tree, a sample of species are all equally distant from their MRCA, distMRCA would be the same for one species or when averaged across all species in a sample. Kind of boring. Also, in many empirical cases, given a sample of taxa, it's likely their MRCA is the root (or near it) of the phylogeny in question. So I let the idea walk to the other side of my mind and forgot about it.
A few weeks ago I noticed that two different folks (one, two) have implemented (with attribution--thanks!) a mean root distance (MRD) function from my now defunct U. of Missouri, St. Louis webpage. Since it fits within the framework introduced in our recent paper, I decided to include MRD in the metricTester package. While updating the MRD code, a variant of the distMRCA function occurred to me. Rather than simply finding the distance of the set of taxa from their MRCA, perhaps the mean of all distances between all pairwise MRCAs and the root would provide a better measurement of subtle variation in the arrangement of present taxa across a phylogeny. For instance, given three species (s1, s2, and s3), the original idea would have simply found the distance of those taxa from their MRCA. The updated idea would be to find the distance of the MRCA of each taxon-pair (s1-s2, s1-s3, s2-s3) from the root. Sounded promising. Maybe you already see where this is going. It took me coding the whole thing out and testing how it behaved until I realized I'd re-invented the wheel (admission: my version is extra heavy and slow rolling). Specifically, I'd come up with a new way of calculating phylogenetic species variability (Helmus et al. 2007), which was really just a new flavor of mean pairwise phylogenetic distance (Webb 2000), which was just a new way of calculating Δ+ (Warwick and Clarke 1995). And so on and so forth. Maybe there are no new phylogenetic community structure metrics under the sun. In retrospect, it's quite obvious why these things should be equivalent. Given an ultrametric tree, the pairwise distance between two taxa is related to their distance from the root. By that, I mean that if the total tree height is 10 mya, and two taxa are separated by a "pairwise" distance of 4 mya, then we know they shared a MRCA 8 mya (10 - 4/2). Obviously, taking the averages of these distMRCA and these MPD values are going to be closely correlated. On the plus side, I thought of a way of abundance-weighting MRD. That is incorporated into metricTester now too. Given my experience with re-inventing the MPD wheel, I figured it would be related to IAC (Cadotte et al. 2010), but an initial test showed that not to be the case. Since it's just a node-based measure, it seems likely it's not of great use to empiricists in today's age of dated phylogenies, but it's there in case someone would like to experiment with it. References: Cadotte, M. W., T. Jonathan Davies, J. Regetz, S. W. Kembel, E. Cleland, and T. H. Oakley. 2010. Phylogenetic diversity metrics for ecological communities: integrating species richness, abundance and evolutionary history. Ecology Letters 13:96–105. 10.1111/j.1461-0248.2009.01405.x Helmus, M. R., T. J. Bland, C. K. Williams, and A. R. Ives. 2007. Phylogenetic measures of biodiversity. The American Naturalist 169:E68–E83. 10.1086/511334 Laliberté, E., and P. Legendre. 2010. A distance-based framework for measuring functional diversity from multiple traits. Ecology 91:299–305. 10.1890/08-2244.1 Miller, E. T., D. R. Farine, and C. H. Trisos. 2016. Phylogenetic community structure metrics and null models: a review with new methods and software. Ecography:In press. 10.1111/ecog.02070 Warwick, R. M., and K. R. Clarke. 1995. New "biodiversity’ measures reveal a decrease in taxonomic distinctness with increasing stress. Marine Ecology Progress Series 129:301–305. 10.3354/meps129301 Webb, C. O. 2000. Exploring the phylogenetic structure of ecological communities: an example for rain forest trees. The American Naturalist 156:145–155. 10.1086/303378 |
AuthorBirdsPlus Index Manager at the American Bird Conservancy Archives
May 2024
Categories |
 RSS Feed
