|
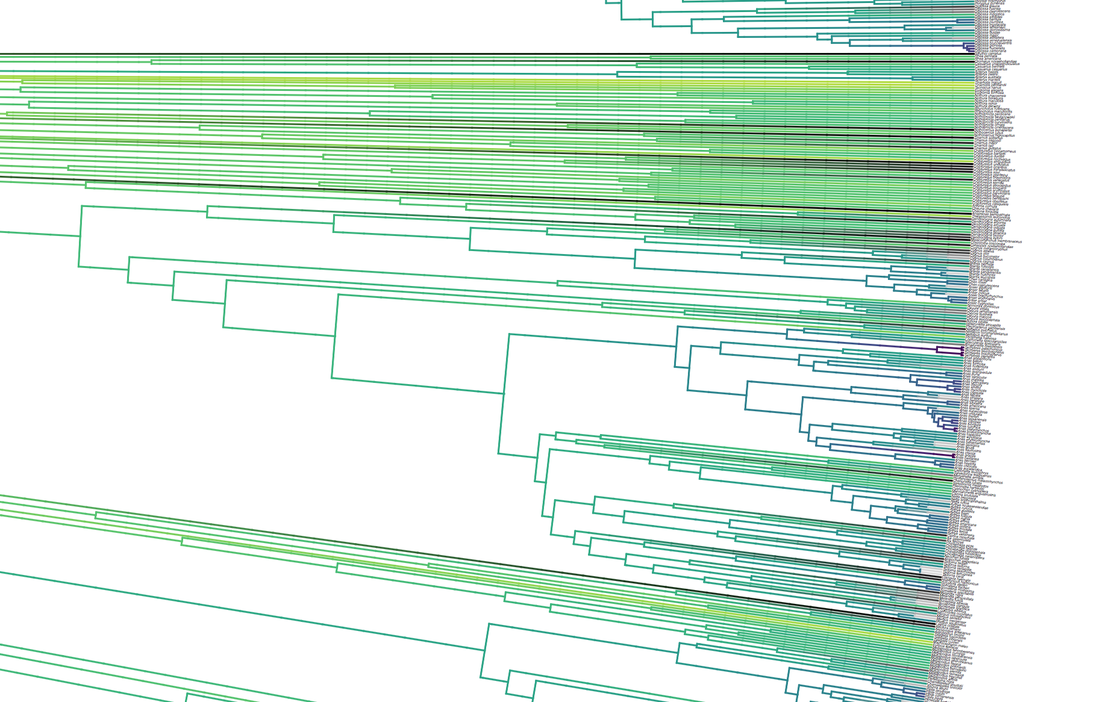
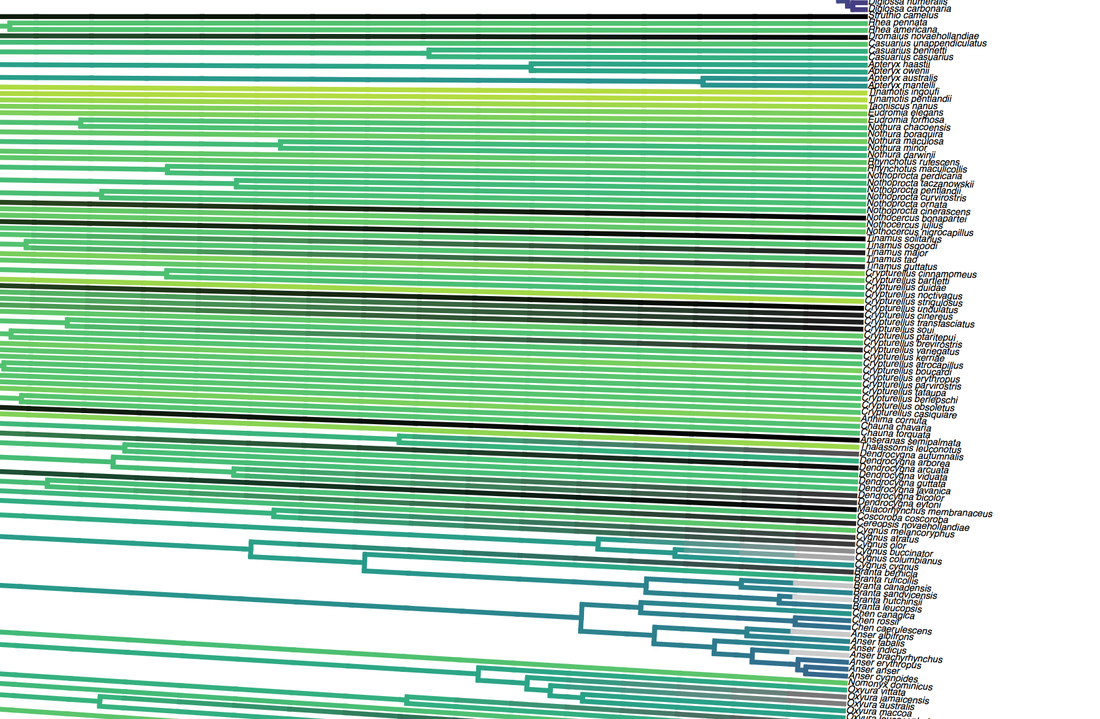
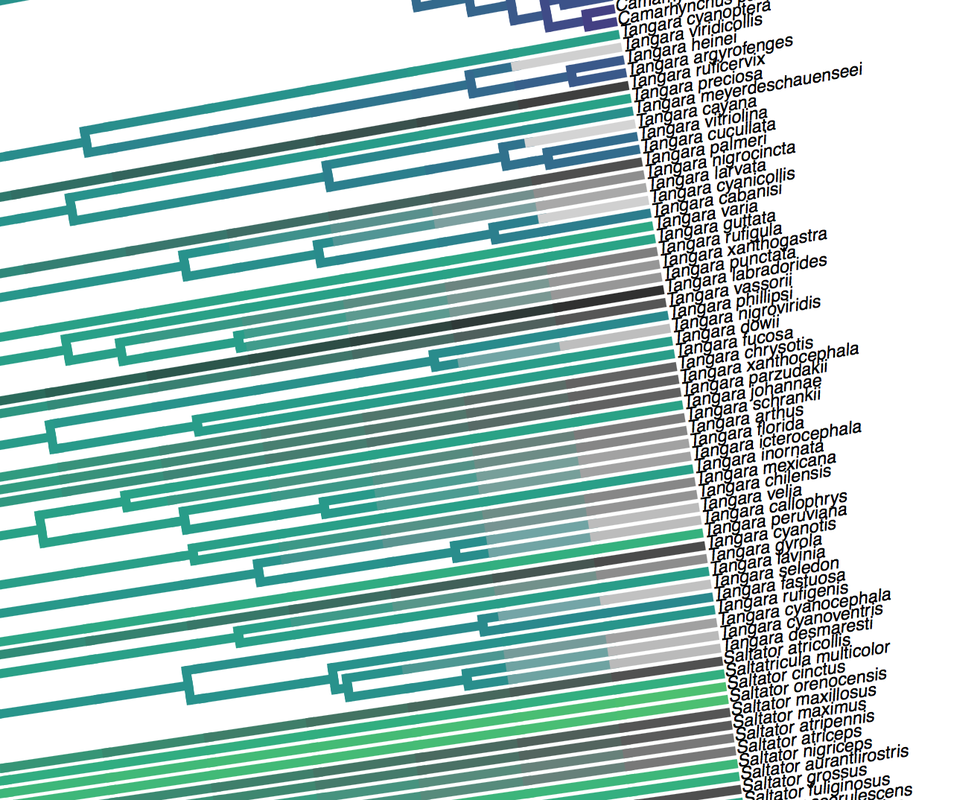
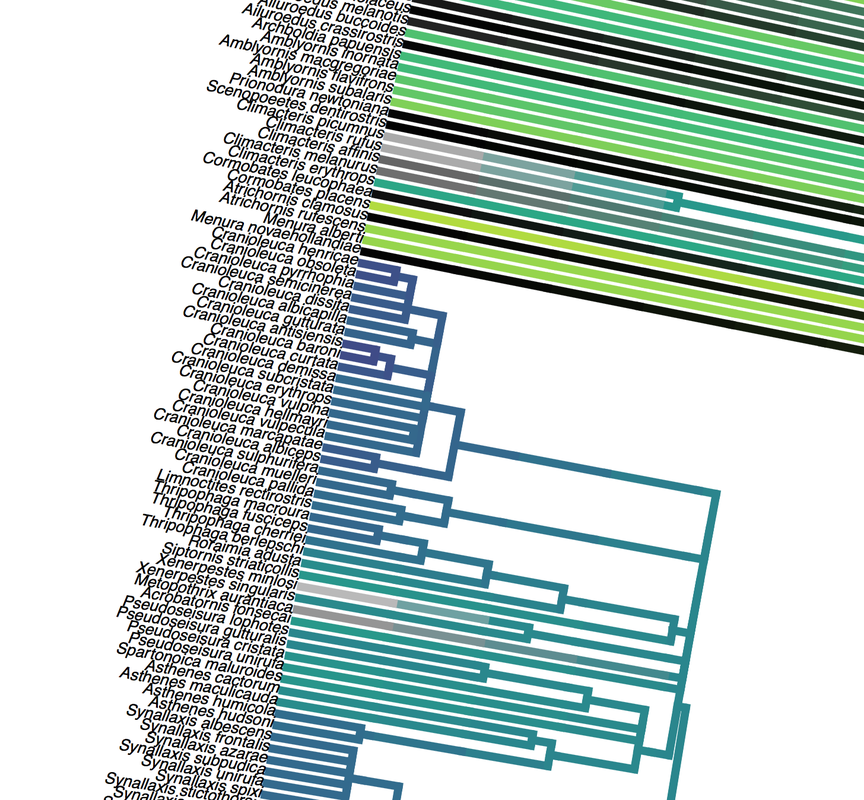
Birders are a curious bunch. There are many millions of them in the world, and they range from mildly to severely obsessed with all things birds. Few things inspire such fevered participation by the fervent, and such bemused wondering by the uninitiated. Who else gets up on purpose at 4 AM on a non-workday? Birding can be a pretty minimalist hobby--you don't need much to watch birds, though a pair of binoculars is nice. Indeed, you don’t even need to see to be a good birder. [Birdwatching does have an unfortunate diversity skew--here's a funny post on that]. Despite that, there is no shortage of ways birders can spend their money. And spend it they do--a 2013 US Fish & Wildlife study estimated birders spend $107 billion/year on their pursuit of our planet's feathered denizens. Pretty cool if you ask me. Like I said, birders vary in the severity of their avian afflictions. There is a subset, not insignificant in absolute numbers, of people who know which birds they've seen, which birds they haven't seen, where those birds live, when to find them, and how to find them...in short, there are at least a couple hundred thousand people in the US who when I say, "there's a Rustic Bunting four hours away", respond, "get in the car." Given that mass of educated, passionate, motivated birders, one might think that there are no new ways to consider which birds one has or has not seen. But, after some discussion with various folks recently who have also had these ideas, it occurred to me that one aspect of birding has not been well explored outside of a few science nerd types. What I'm proposing here is a phylogenetic life list. In this context, evolutionarily unique species are "worth more". You might have been excited this spring when you ticked your first Golden-winged Warbler, but let me temper that enthusiasm for you. What you saw was, in an evolutionary sense, barely distinguishable from a Blue-winged Warbler (Toews et al. 2016). Come talk to me when you've seen a Kagu in the mountains of New Caledonia. Playing this sort of listing game, all new species (branches on the evolutionary tree) count towards your phylogenetic life list, but evolutionarily unique species count more. Put differently, seeing a Golden-winged Warbler (or a Kagu) ticks off one of the ~10,000 bird species to see globally under a traditional counting strategy (0.01% of all species to see in the world). But, under a phylogenetic life list strategy, seeing a Golden-winged Warbler ticks off just 0.003% of global unique evolutionary diversity, while seeing a Kagu adds 0.13%! I should digress and say taxonomy is hard. Converting the taxonomic concepts in my eBird life list to the taxonomy used by the Jetz et al. (2012) world bird tree took me a week's work. After that though, the rest was pretty easy. For the purposes of this post, there are two ways to consider evolutionary uniqueness. The length of the pendant edge of the species in question, and the mean relatedness of that species to all others. The pendant edge describes the amount of time that branch of the tree of life has been evolving on its own path (all caveats about extinction aside). Take the Kagu. It's evolutionarily unique according to this measure because its closest extant relative is the Sunbittern. They last shared a common ancestor 63 million years ago. Seeing a Kagu is kind of like seeing a velociraptor. In contrast, the mean relatedness describes the average evolutionary distance of a species to all others. In this context, species like tinamous and ostriches are even more evolutionarily unique than the Kagu, because tinamous and such are distantly related to the vast majority of other birds. I've made some visualizations to go along with this idea. This first one shows the world bird tree, pruned to the bird species that I've seen (according to eBird and as converted to world bird tree taxonomy). The evolutionary uniqueness of these species, according to the pendant edge method, is color-coded on there. I've also stretched branches out as a function of the pendant edge, so that evolutionarily unique species are colored in yellow, and are situated on long spines out from the tree. A friend affectionately called this an urchin plot. The plot is too low-resolution to zoom in, so I'll narrate it for you. At 3 o'clock are the Ostrich and Emu, and at 4 o'clock are the Sunbittern and Oilbird. Over at 8 o'clock is the Sapayoa. [I'm 100% convinced that there is a tight correlation between one-word bird names and evolutionary uniqueness, much like the tight correlation between one-word soccer player names and soccer skill]. 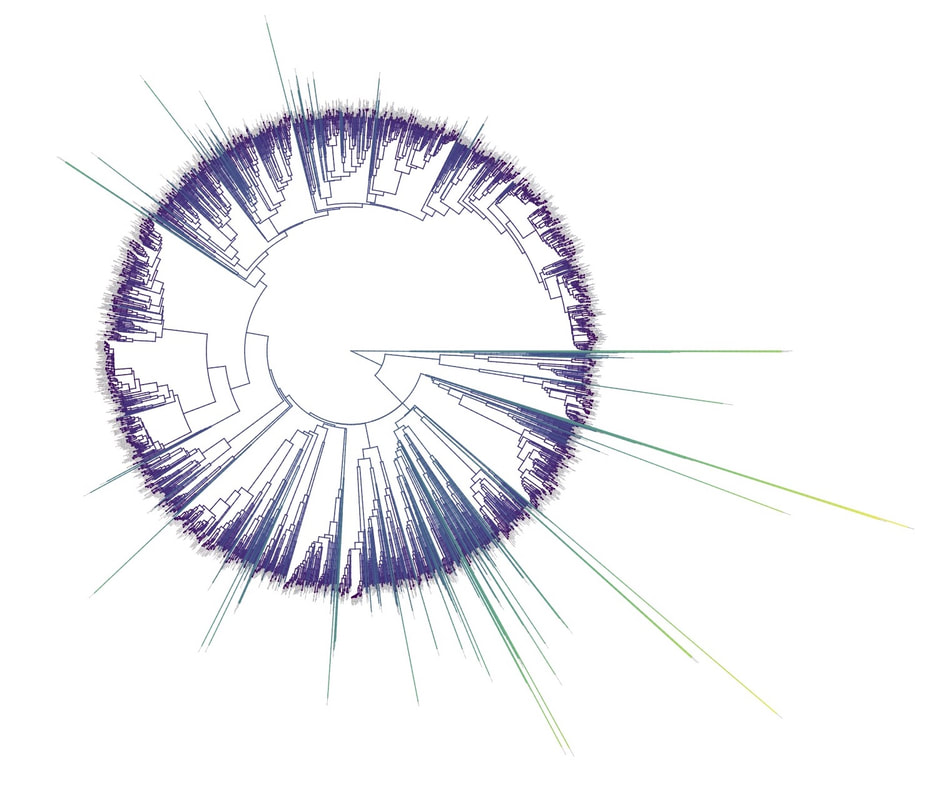 This second one shows the evolutionary uniqueness of all the species I've seen according to the mean distance measure. Here, tinamous and the like are really unique, whereas passerines, which comprise the bulk of avian diversity are not. 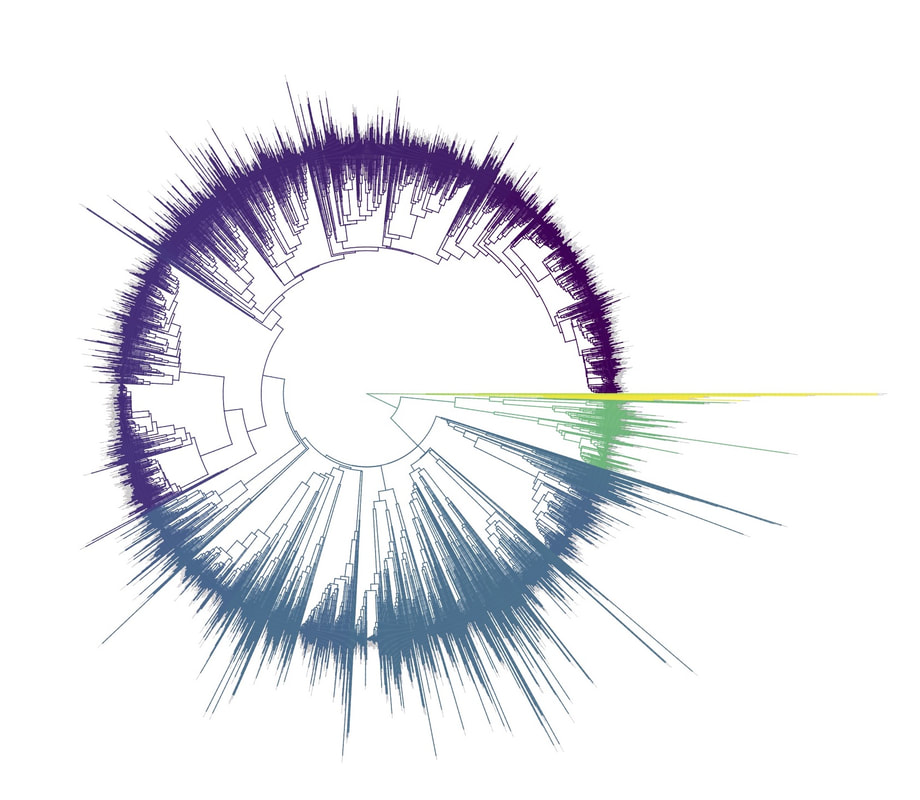 Last up is the entire world bird tree, with species I have and have not seen color-coded according to their (pendant edge) evolutionary uniqueness. Gray = not unique, I have seen it. Black = unique, I have seen it. Blue = not unique, I have not seen it. Yellow = unique, I have not seen it. Because it's such a large file, and I'm just adding a jpg of the zoomable pdf, I've added a few screenshots here to get a better sense of what's going on. 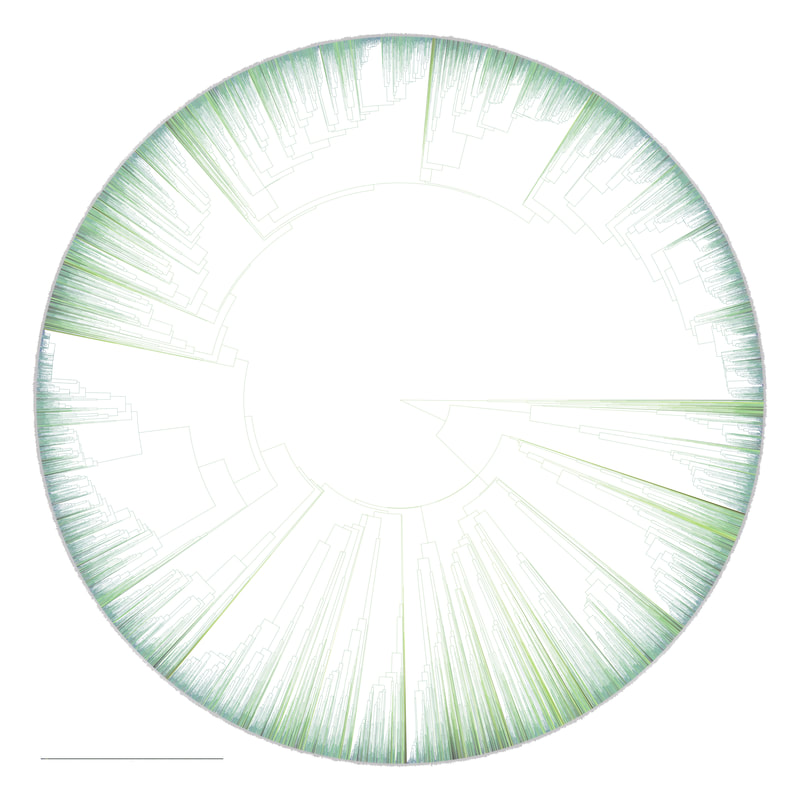 I see some obvious extensions of this. First, to return the hordes of interested birders, it would be pretty amazing to be able to generate these sorts of plots for any user of eBird, and serve these up in a more interactive setting. I think it presents some great opportunities for helping people to think about evolution and practice tree-reading skills. I'm thinking OneZoom-ish. Second, it would be really interesting to be able to put the phylogenetic life list in a geographic context. For instance, where on Earth should I go to see the most novel phylogenetic diversity in the most geographically constrained area? Or, if I visit my aunt in southern California, what would be the most evolutionarily unique species I might see?
Literature cited: David P.L. Toews, Scott A. Taylor, Rachel Vallender, Alan Brelsford, Bronwyn G. Butcher, Philipp W. Messer, Irby J. Lovette. 2016. Plumage Genes and Little Else Distinguish the Genomes of Hybridizing Warblers. Current Biology 26:2313-2318. DOI: http://dx.doi.org/10.1016/j.cub.2016.06.034 W. Jetz, G. H. Thomas, J. B. Joy, K. Hartmann, A. O. Mooers. 2012. The global diversity of birds in space and time. Nature 491: 444-448. doi:10.1038/nature11631
9 Comments
I'm excited to report that our first paper using citizen scientist-collected behavioral observations has been published in Behavioral Ecology (Miller et al. 2017). Well over a thousand FeederWatchers participated in the project, collecting data on aggressive interactions at feeders around North America. We assembled these interactions into a large directed network, and calculated some metrics of dominance. Ultimately, we settled on a modified version of the Bradley-Terry model (Bradley and Terry 1952) to calculate a species' dominance--other approaches yielded results that didn't make any biological sense.
In and of itself, this was a neat product--a continental dominance hierarchy of feeder birds! But what determined species' positions in the hierarchy? We found that, unsurprisingly, body mass explained a lot of the variance in species' positions. However, certain lineages (e.g., families) of birds tended to be more or less dominant than expected based on their body mass. Presumably, the members of these lineages share certain traits that make them more or less aggressive. Take woodpeckers for instance: long, heavy bills they wield against unwielding substrates every day. Or warblers: little, feather-clad bundles of anger. Ok, maybe that's not really a trait, but you get the point. We also looked for the existence of rock-paper-scissors relationships in the data. These sorts of relationships are interesting, as they are thought to promote local species coexistence (Levine et al. 2017); no species is able to gain a competitive advantage over all others. We found few such instances of these relationships, but those that we did find tended to involve invasive species. This seems like something worth following up in the future! Stay tuned for an upcoming blog about the paper on the FeederWatch page. Soon thereafter, keep your eyes peeled for a glossy article in the Living Bird, complete with original illustrations by Jillian Ditner! (http://jillianditnerstudios.com/). Literature cited: Bradley, R.A & M.E. Terry. 1952. Rank analysis of incomplete block designs: I. The method of paired comparisons. Biometrika. 39:324–345. Levine, J.M., J. Bascompte, P.B. Adler & S. Allesina. 2017. Beyond pairwise mechanisms of species coexistence in complex communities. Nature. 546:56-64. doi:10.1038/nature22898 Miller, E.T., D.N. Bonter, C. Eldermire, B.G. Freeman, E.I. Greig, L.J. Harmon, C. Lisle & W.M. Hochachka. 2017. Fighting over food unites the birds of North America in a continental dominance hierarchy. Behavioral Ecology. Online Early. doi:10.1093/beheco/arx108 |
AuthorNSF post-doctoral researcher studying species interactions Archives
April 2019
Categories |
 RSS Feed
